How much is a home in Oreland actually worth right now? Type that question into a search bar and open three tabs, and you will get three different answers before your coffee cools. One site says the average value climbed to $528,270 as of June 2026, up 4.2% over the past year. Another shows the median sale price falling 20.6% year over year to $385,000 in February 2026. A third, pulling from the trailing twelve months of closings, lands at $515,000. A fourth aggregator quotes $531,500 with no clear reference to which month it means.
None of these sites is lying. They are answering different questions, over different windows, in a market too small to hold still long enough to give one clean answer. If you are trying to price a listing or size up a purchase in Oreland this month, the portal median is the least useful number on the page. The Bright MLS closing sheet for July 2026 is the one that matters, and it tells a story none of those percentages capture.
The Four Numbers That Don't Agree
Here is what a buyer or seller sees when they check the usual sites in the same week:
Source | Figure | Window |
|---|---|---|
Zillow Home Value Index | $528,270 average value, up 4.2% | As of June 2026 |
Redfin | $385,000 median sale price, down 20.6% | February 2026 |
Homes.com | $515,000 median sale price, up 1% | Trailing 12 months, 55 sales |
Aggregator site | $531,500 median home value | Undated |
That is a $146,500 spread across the four portal figures in the same general period, and a headline that reads either "up 4%" or "down 20%" depending on which tab you trust. A gap that size in a larger market like Ambler or Glenside would be a red flag about data quality. In Oreland, it is closer to how the math is supposed to work.
What Bright MLS Actually Recorded in July
Set the portals aside and look at what closed. Bright MLS data for July 1 through July 31, 2026 shows nine sales in Oreland, ranging from $367,500 to $935,000, with a median of $560,000. Four of the nine landed between $500,000 and $625,000, which is the neighborhood's usual band. The top sale, a six-bedroom home at $935,000, pushed the month's ceiling well past June's high of $735,000.
Days on market told a similar story of speed with a small wobble. July's closings sold in a median of seven days, a step off June's five-day pace but still fast by any regional standard. Five of the nine sales closed over asking price. The slower listings sat in the upper half of the price range, while the fastest properties went under agreement the day they hit the market.
Nine closings is a real month of turnover for a neighborhood this size. It is also a small enough sample that one unusual sale changes the story completely.
Why a Market This Small Can't Hold Still
Oreland's entire housing stock runs somewhere between 2,200 and 2,900 units, depending on whether you're counting the census-designated place or the wider 19075 zip code. Active inventory in a typical month stays in the single digits. When your total pool of available homes is that thin, a rolling twelve-month median calculated by a national portal is measuring a moving target with a very small sample at any given point.
This is why one $935,000 sale can move a monthly median by tens of thousands of dollars, and why a portal's year-over-year percentage can swing from a healthy gain to a steep decline depending on which handful of closings happened to fall in the comparison window. A market with hundreds of closings a month absorbs an outlier without much notice. A market with nine absorbs it as a headline number.
None of the four portal figures above is technically wrong. Each is built from a slightly different set of closings, on a slightly different calendar, using a slightly different method. In a market this size, that is enough to produce answers that look like they describe different neighborhoods.
Two Different Markets Hiding Inside One Median
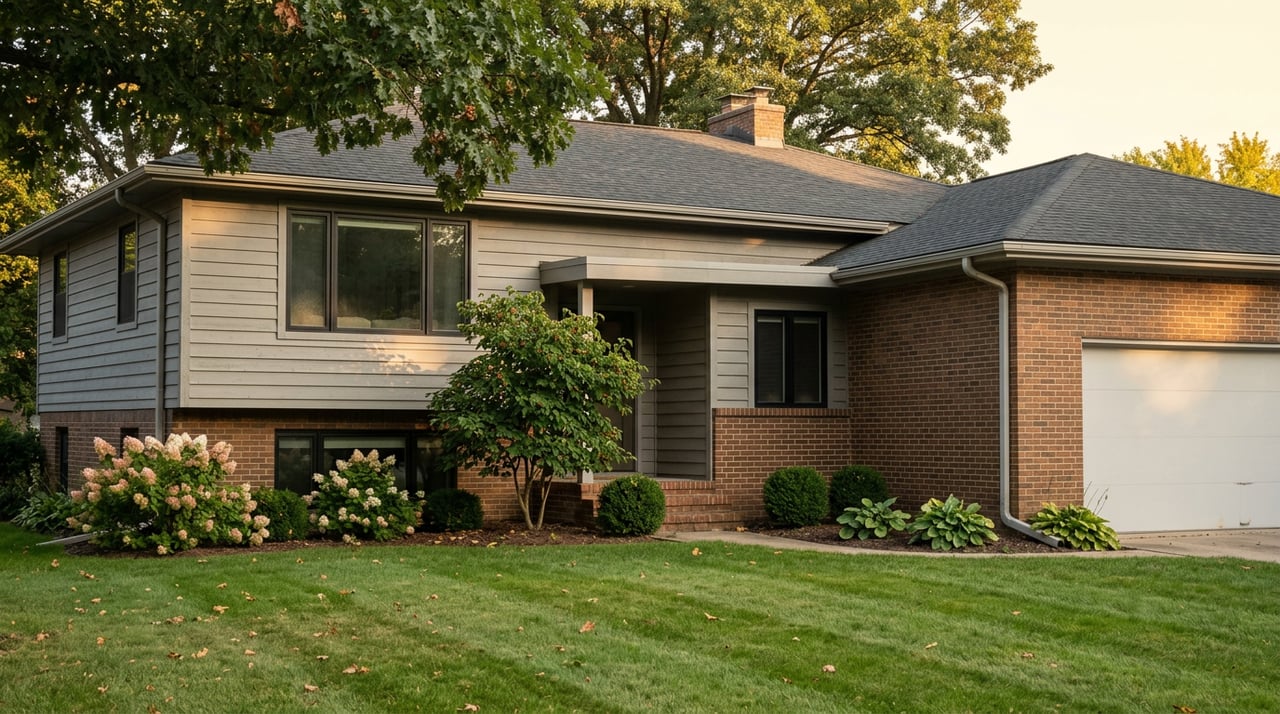
The more useful way to read July's numbers is to split them in two. The core of Oreland's market, the four sales between $500,000 and $625,000, represents the neighborhood's bread and butter: mid-century Colonials, split-levels, and Cape Cods that have been carefully maintained by long-term owners on established streets. That core band moves fast, often under agreement within a week, and it is where most buyer competition actually plays out.
The $367,500 sale at the low end and the $935,000 six-bedroom at the high end are a different market entirely. They represent condition, size, or lot characteristics that fall outside the typical Oreland home, and they are exactly the kind of outlier sales that can drag a monthly median in either direction depending on which side shows up in a given thirty-day window.
If you are comparing your own home, or a home you are considering, to "the Oreland median," the first question worth asking is which band it actually belongs to. A well-kept split-level in the $500s is answering a completely different market question than a six-bedroom outlier at $935,000, even though both feed into the same headline number.
The Township Line Is Its Own Price Lever
Oreland sits across two municipalities, Springfield Township and Upper Dublin Township, each with its own school district. That boundary runs through the middle of the neighborhood, not around its edge, which means two homes a few streets apart can carry different school assignments and different tax structures depending on which side of the line they fall on. It is a real, documented feature of how Oreland is drawn, not a rumor.
That split adds a second layer of variation on top of the thin-market swings already described. A buyer comparing two similarly priced homes should ask which township each one sits in before assuming the properties are otherwise interchangeable.
A portal median answers a question about an entire year. A seller pricing a home this month needs an answer about this month.
What This Means If You're Buying or Selling in Oreland Right Now
For sellers, the practical takeaway is that pricing off a national portal's trailing median risks anchoring to a number that may already be several months and several outlier sales out of date. The more reliable approach is to look at what actually closed in the most recent thirty-day window and where your home fits within that range, not the twelve-month blend a portal displays.
For buyers, the takeaway is similar in reverse. A listing priced in the $500s to $625,000 range is competing in the fast-moving core of the market, where offers over asking and single-digit days on market have been the norm through the summer. A listing priced well above or below that band is playing a different game, one where the usual pace and competition level may not apply.
Either way, the number worth trusting is not the one at the top of a portal search result. It's the one built from actual closings in the actual month you're making a decision, which is exactly the kind of detail a national algorithm can't see and a local agent tracking the MLS week to week can.
FAQs
Why did one site show a 20% price drop when others showed a gain?
Different sites calculate over different windows using different sales. A neighborhood this small can post a steep-looking year-over-year swing simply because a handful of higher-priced homes closed in the comparison period last year but not this year, or the reverse.
How did Oreland's monthly price ceiling change from June to July?
Based on the pattern between June and July 2026, meaningfully. June's ceiling sat at $735,000; July's stretched to $935,000 on a single sale. In a market with single-digit monthly closings, that kind of movement is normal rather than alarming.
If you're weighing a purchase or a sale in Oreland and want a read on where your specific home or budget actually falls within the current market, rather than a blended number from a portal, Diane Reddington tracks these closings month to month across Montgomery County. Let's Connect.
This article is general information, not legal, tax or financial advice. Consult a qualified professional about your situation.